The problem: different systems, overlapping sales
Easy USA is an established wholesale footwear business. Most sales come through direct accounts, phone orders, and EDI, alongside online channels. Weekly reporting meant running Python scripts and assembling Excel files from an aging accounting system.
The difficult part was knowing which numbers belonged together. Online orders are entered into Sage BusinessWorks too. Adding Shopify, OpenCart, or Faire revenue to the accounting total would count the same sales twice. And after moving from OpenCart to Shopify in August 2026, we needed a fair way to compare the new store with the old one.
Start with rules the business can trust
I built the reporting around Sage as the source of truth for company revenue, with online channels treated as subsets of that total. Shopify order numbers are matched to Sage invoices to connect the storefront with accounting.
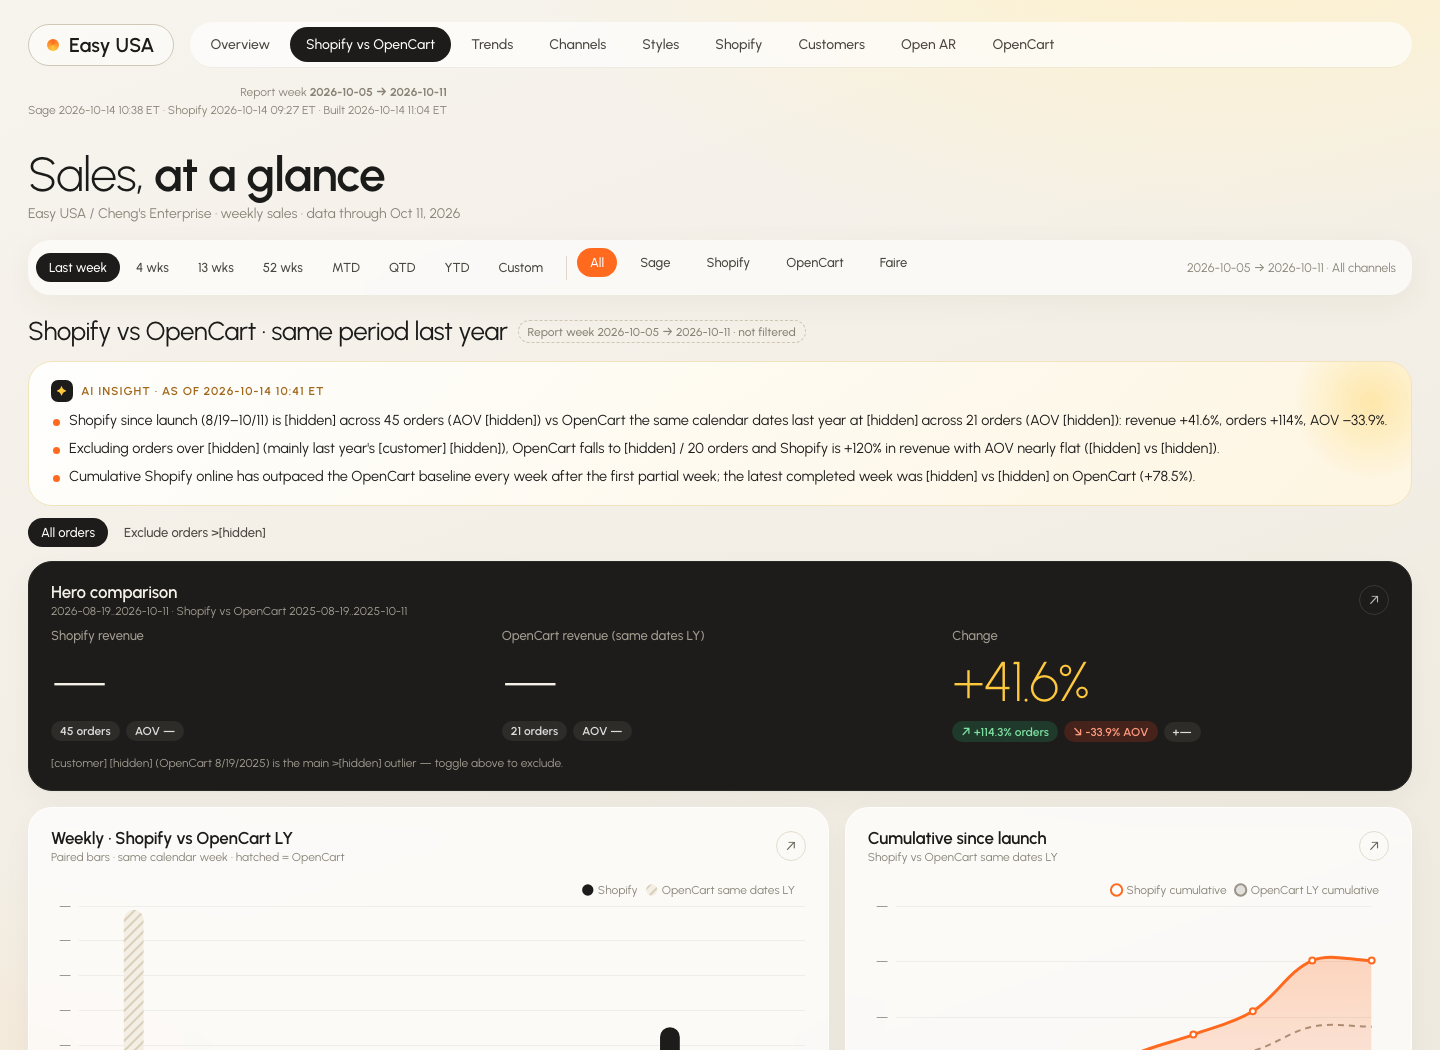
Weekly reporting uses completed Monday-to-Sunday weeks, and year-to-date totals reset on January 1. The Shopify comparison uses the same period in the previous year, with an option to exclude outlier orders so a single large purchase doesn’t obscure the underlying pattern.
Build a tool people can explore
The private dashboard uses clear KPI cards, compact navigation, and interactive charts. Date and channel filters let the team move from a company-wide view into Shopify, OpenCart, Faire, or Sage. Presets cover recent weeks, month-to-date, quarter-to-date, and year-to-date, with custom week ranges when needed.
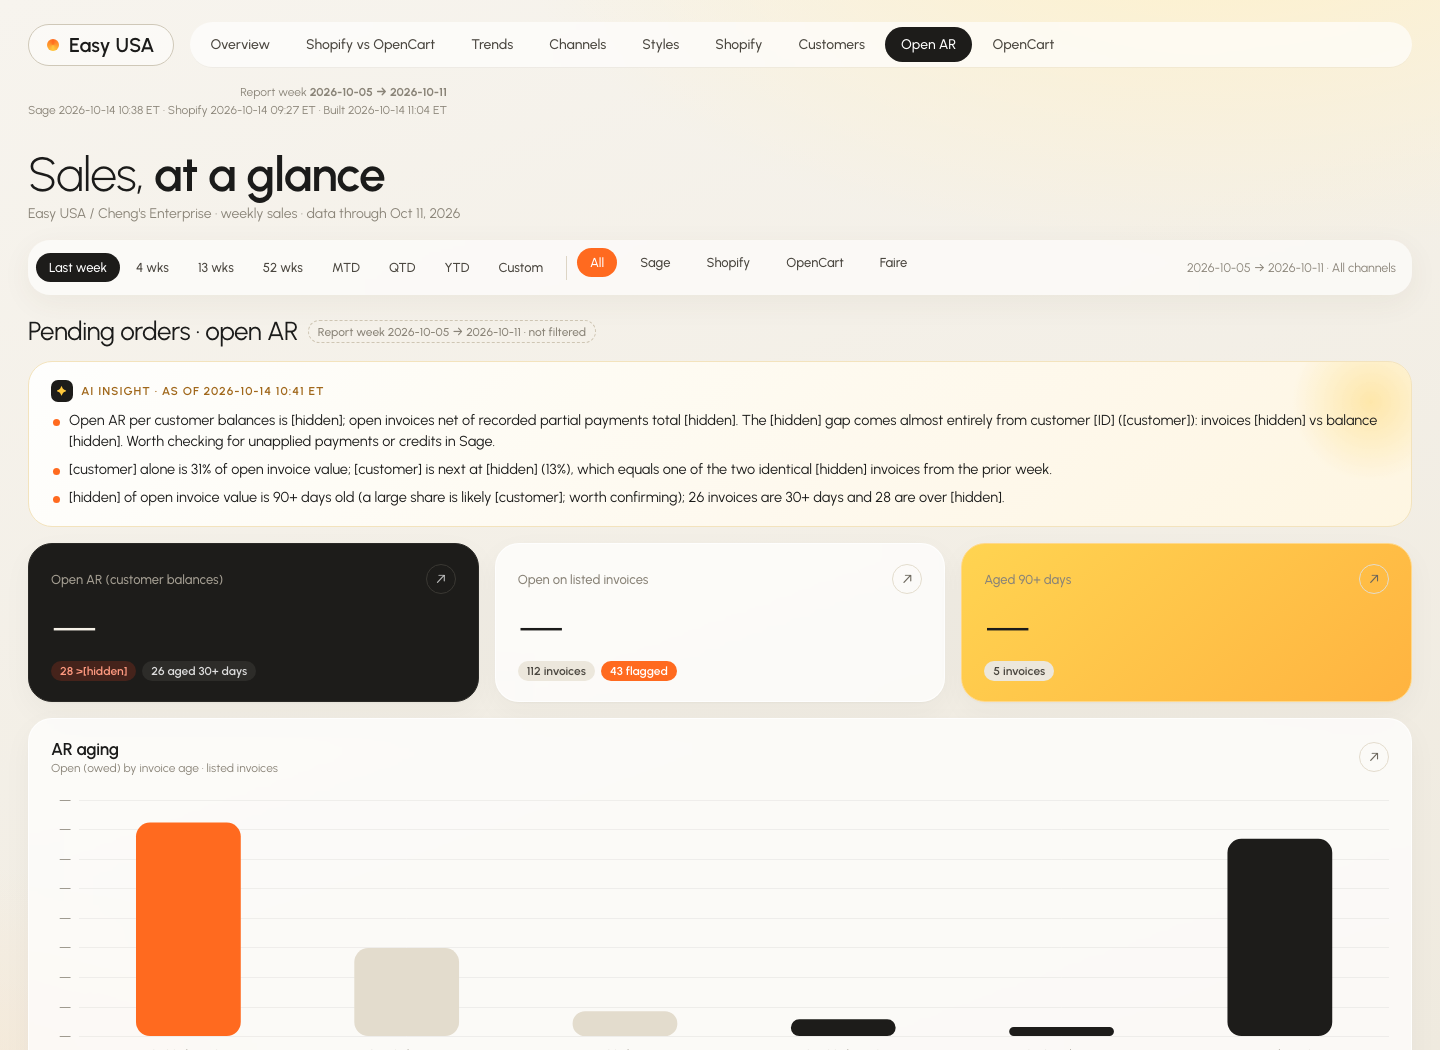
The Shopify-versus-OpenCart view pairs weekly bars with cumulative lines and compares revenue, orders, and average order value. Other sections cover trends, channel mix, top styles, the Shopify funnel, customers and movers, open receivables and aging, and historical OpenCart performance.
AI helps explain the numbers
AI is a substantial part of how I built the system, and it also has a defined role inside the finished product. Each section gets a written summary of trends, outliers, and issues worth investigating.
The summaries are generated from a prepared fact digest rather than asking the model to invent or independently calculate figures. A safeguard hides a summary when it no longer matches the current data. That keeps an old explanation from sitting beside newly refreshed numbers.

From manual reports to a scheduled pipeline
Python pulls accounting and historical OpenCart data through read-only database connections over a secure tunnel, alongside Shopify API data. It then builds the fact digest, generates summaries, renders the dashboard with Chart.js, and deploys the static site behind Vercel Authentication.
A scheduled AI-agent routine runs each weekday at 6 a.m. Eastern. Tuesday adds a digest and a full Excel workbook saved to Google Drive. Database access is SELECT-only, sensitive fields are excluded by guards, and credentials stay in environment variables.
What changed
Reporting moved from a manual weekly process to an automated weekday refresh. The team can examine the new store against the old one without reconstructing the comparison each time.
The October project snapshot showed Shopify revenue approximately 42% above OpenCart for the same period last year, with more than twice as many orders. Excluding one unusually large prior-year order, revenue was approximately 120% higher. Showing both views makes the effect of that order explicit.
The summaries also surfaced questions worth following up: a possible duplicate invoice behind a spike, a receivables balance discrepancy, and a customer recorded under two names. These are investigation leads, not automatically resolved accounting findings.
Part of modernizing Easy USA
The storefront was one step. This project connects the newer sales channels with the systems the business still relies on, creating a more dependable foundation for daily decisions.